How to Leverage Infographics for Link Building Services
Why do some websites seem to get backlinks almost effortlessly, while others struggle month after month? If you’re investing in professional link building services, one powerful but often underutilized strategy you should consider is infographic link building.
When done right, infographics can act as link magnets. They attract attention, generate shares, and earn authoritative backlinks. All of these benefits boost your SEO, visibility, and credibility.
In this post, we’ll cover:
- What infographic link building really means
- Why it works
- How to use it effectively
- How to integrate it into your own link-building campaign
What Is Infographic Link Building?
Infographic link building is a digital marketing tactic. Initially, you gather well-researched information or data. Next, you turn it into a visually appealing infographic. Afterward, you distribute or pitch it to other websites, blogs, and content creators. Ultimately, the goal is for them to embed it in their content and link back to you.
In other words, instead of relying solely on traditional text-based content, you create a “linkable asset.”
Moreover, a visually compelling infographic often gets more attention and shares than a plain article. Consequently, it becomes a smart choice for anyone using Link Building Services who wants results that truly stand out.
By combining data, design, and outreach, infographic link building therefore provides a strategic and scalable way to earn backlinks that genuinely matter.
Types of Infographics That You Can Use
Not all infographics are created equal. Depending on your niche and the type of data you have, some formats work better than others. Here are common types that are especially effective for link-building:
1. Timeline Infographics
Show the evolution or history of something over time, such as industry trends, company growth, or market changes. They are excellent for storytelling and keeping readers engaged.
2. Statistical / Data‑Driven Infographics
These use charts, graphs, and numbers to visualize survey results, market data, or research findings. They are perfect when you want to demonstrate credibility and depth.
3. Comparison Infographics
Compare two or more options, products, or approaches side by side. They are ideal for “versus” style content, which many blogs enjoy linking to.
4. Process Infographics
These outline steps, workflows, or “how‑tos” in a visually digestible way. They work well when you need to explain complex processes in your niche.
5. Geographic Infographics
Use maps or spatial data to show distribution, regional differences, or location-based trends. They are especially useful for niches involving demographics, market analysis, or regional insights.
6. Listicle / Resource Infographics
These present a set of “10 tips,” “8 statistics,” or “7 best practices.” They are easy to digest and highly shareable, making them great for attracting backlinks.
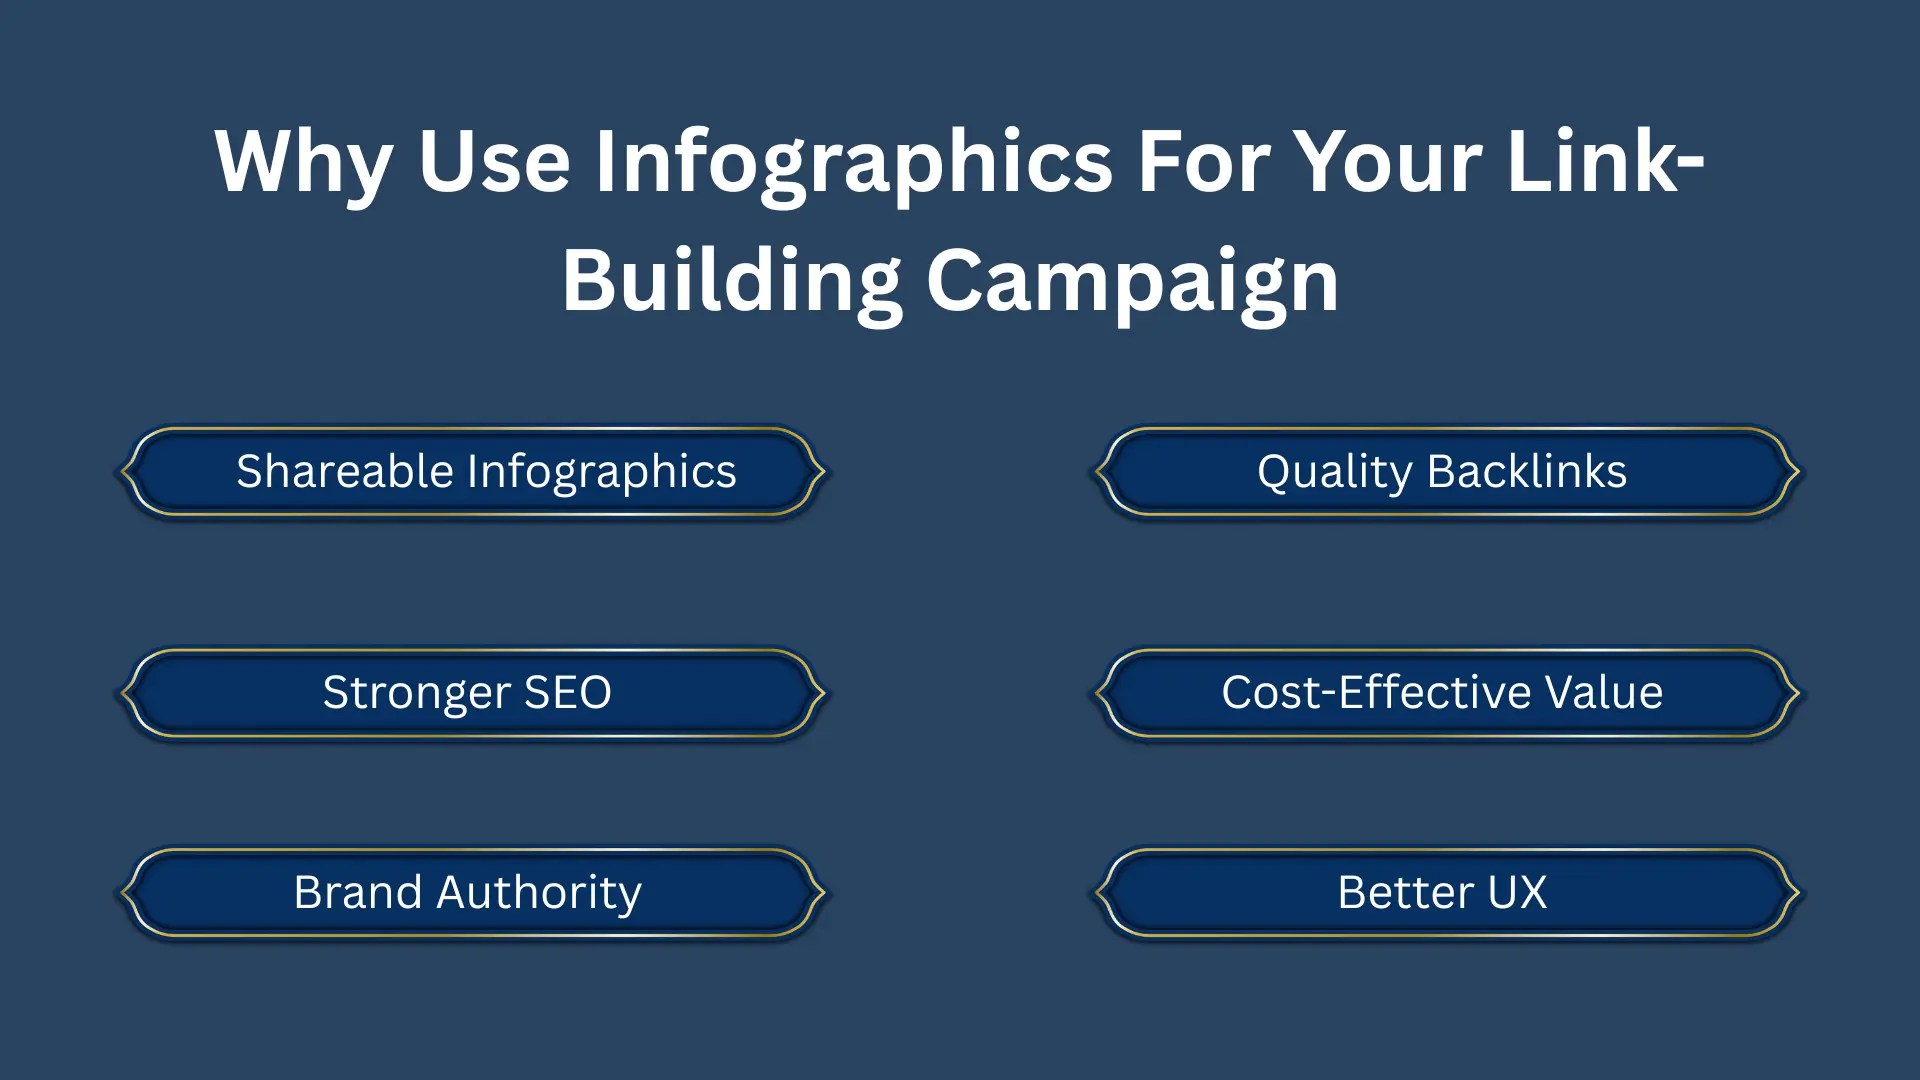
Why Use Infographics For Your Link-Building Campaign
If you are wondering whether to invest time or money in infographic outreach, here are the key benefits of Link Building Services that make it worth considering.
1. Infographics are more shareable and engaging
People naturally respond to visuals. A well-designed infographic grabs attention. It simplifies complex information and encourages sharing. Compared to long, text-heavy articles, infographics often get more engagement, social shares, and visibility. For example, a single infographic can go viral across blogs and social media.
2. Higher chance of earning quality backlinks
Infographics package value in a quick, digestible format. Bloggers, journalists, and content creators are more likely to embed them in their content. Especially when the data is relevant and authoritative, your site can earn backlinks from high-quality sites. Therefore, infographics serve as a powerful tool to boost your SEO.
3. Improved SEO, domain authority, and traffic over time
Backlinks remain a key ranking factor. When multiple external sites link to your infographic, your site’s authority grows. This can improve your search rankings, increase organic traffic, and enhance visibility. Moreover, the more authoritative your backlinks, the more trust search engines place in your website.
4. Cost‑effective and long-lasting value
Once created, an infographic can generate traffic and backlinks for months, even years. The initial investment, research and design, pays off long-term. In addition, it reduces the need to constantly produce new content, making it an efficient and sustainable asset.
5. Build brand authority and credibility
Publishing high-quality, research-backed infographics positions you as an expert. This builds trust and credibility within your niche. For agencies offering link-building services, it helps clients see your expertise. Consequently, your reputation strengthens while your audience grows.
6. Better user experience for your audience
Infographics simplify complex data or concepts. They make content easier to read and more engaging. For readers, this reflects positively on your professionalism. In addition, a better user experience keeps your audience coming back, which is essential when building a loyal following.
How to Create a Compelling Infographic for Link Building
Now that you understand the benefits, how can you create an infographic that actually works? Follow this process:
1. Pick a Topic Relevant to Your Audience
Start by understanding your audience. Use keyword research and market insights to find topics that matter.
For example:
- “2025 SEO Trends”
- “Common SEO Mistakes”
- “SEO vs PPC: ROI Comparison”
Focus on subjects that people are likely to reference or search. This increases your chances of earning backlinks.
2. Gather Accurate and Up-to-Date Data
Use reliable sources such as:
- Industry reports
- Surveys
- Databases
- Your own research
Unique and credible data boosts the value of your infographic. Always cite your sources. Transparency builds trust. Other sites are more likely to link when your data is verifiable.
3. Design with Clarity and Visual Appeal
Good design is key. Keep your infographic:
- Clean and readable
- Organized with sections and icons
- Easy to follow with charts or graphs
Avoid clutter. Break information into digestible chunks.
You can use tools like Canva, Piktochart, or Visme. These tools help create professional visuals even if you aren’t a designer.
4. Optimize for SEO and Accessibility
SEO makes your infographic discoverable.
- Name your file with keywords: seo-trends-2025-infographic.png
- Add alt text describing the content naturally using your target keyword
- Publish on a dedicated landing page or blog post with an introduction and a short summary
Adding context helps search engines and encourages sites to embed your infographic.
5. Include an embed code & clear CTA
- Provide an easy-to-copy embed code (HTML snippet) so other site owners can embed the infographic easily, with a link back to your page. That makes outreach more frictionless. This is often referred to as the “guestographic” or embed‑code approach.
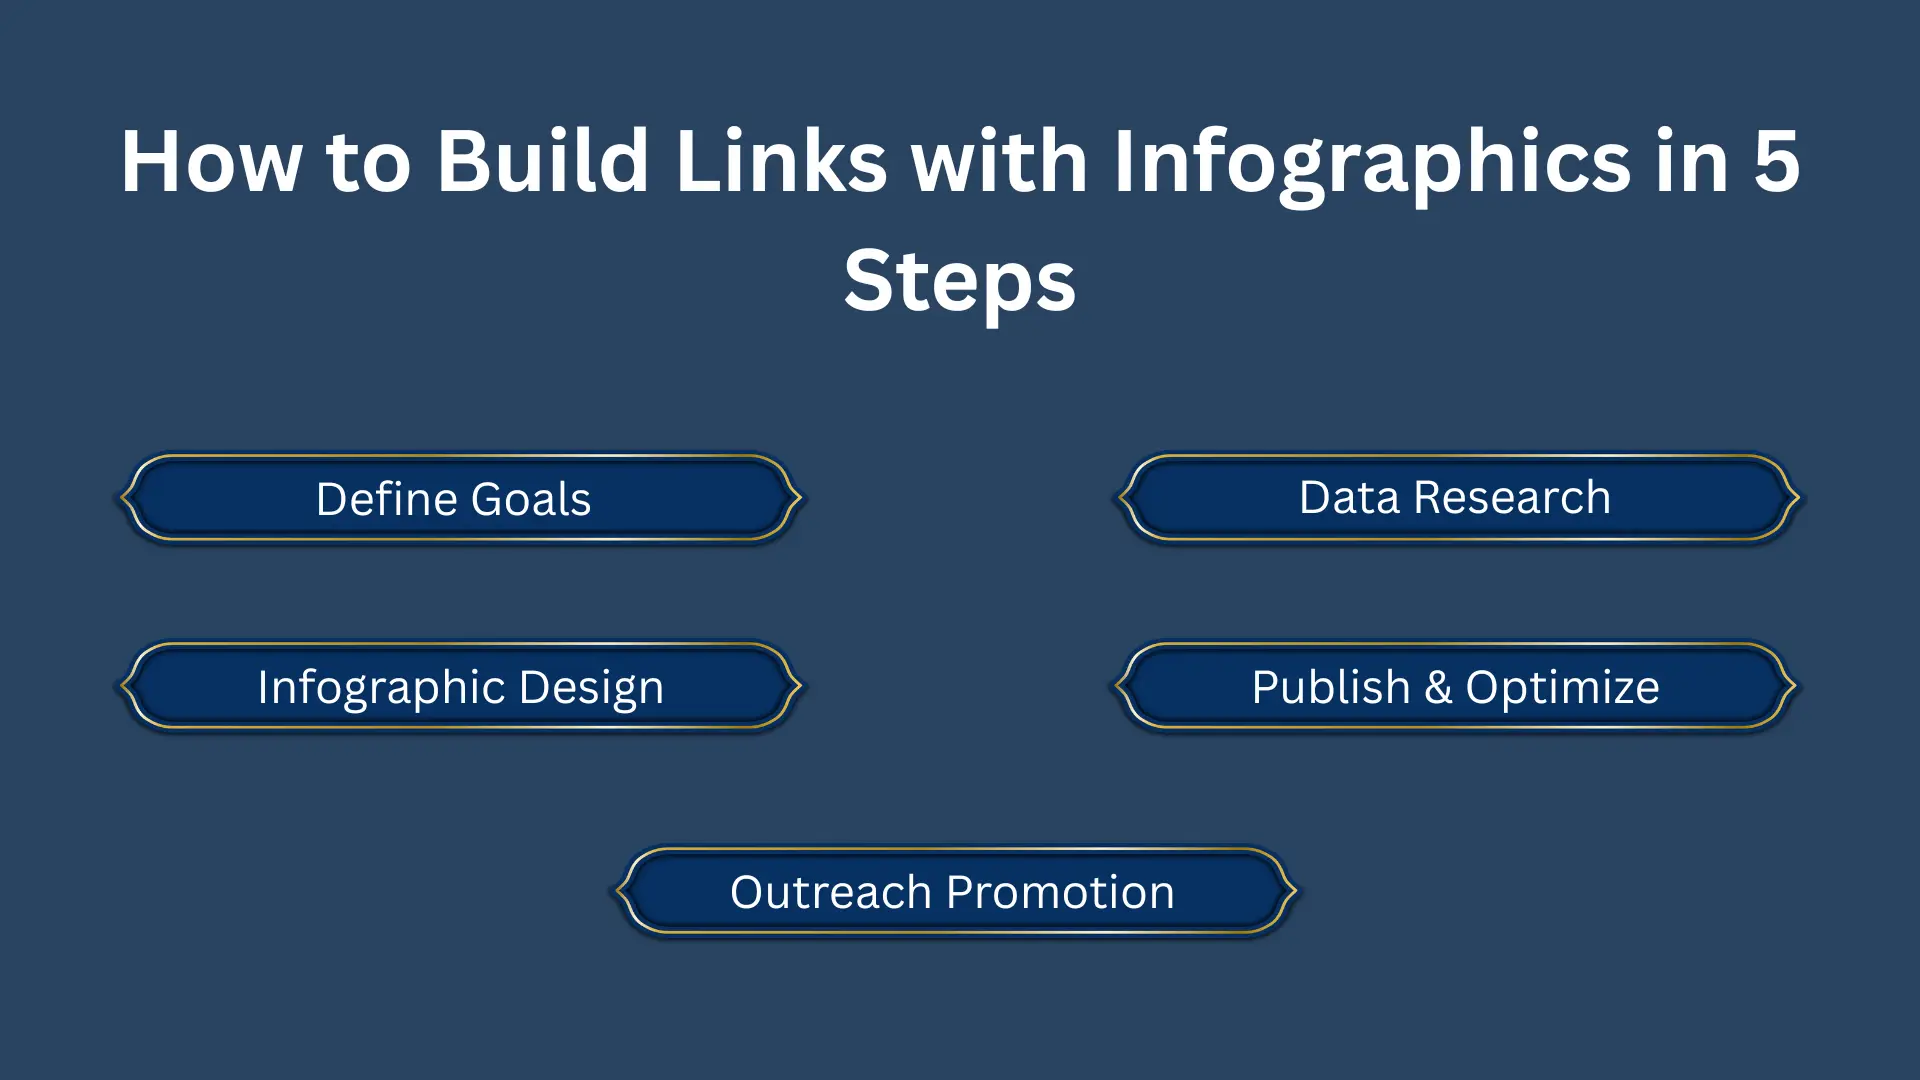
How to Build Links with Infographics in 5 Steps
If you want to leverage infographics as part of your Link Building Services strategy, here’s a five-step workflow you can follow to maximize effectiveness:
1. Define your goal and target audience
- Are you trying to raise brand awareness? Drive organic traffic? Earn backlinks from authoritative blogs? Maybe you’re offering link-building services to clients and want to showcase expertise. Clarify your goal first.
- Understand your audience: their pain points, what kind of content resonates, and what data or insights they value. An infographic that solves a real problem or answers pressing questions is more likely to be shared.
2. Research & gather data
- Use credible sources, gather statistics, compile insights, or run original research if possible. The more unique and authoritative the data, the better the infographic will perform.
- Double-check data accuracy. Faulty or outdated data can harm credibility and then your Link Building Services lose value.
3. Design the infographic
- Focus on clarity, readability, and clean design. Use tools or hire a designer depending on your budget and resources.
- Keep the design aligned with your brand (colors, fonts, style), as this helps build brand recognition.
4. Publish & optimize for SEO
- Host the infographic on a dedicated page with supportive content: a short intro, explanation, or context. This helps search engines understand the topic and improves your chances of ranking.
- Use best practices: keyword-rich title, meta description, alt text, optimized URL, and file name.
5. Outreach & promotion
- Reach out to niche blogs, content creators, journalists anyone who might find your infographic valuable for their audience. Offer the infographic with an embed code to make linking easy.
- Submit to infographic directories or platforms that accept infographics to increase visibility.
- Share on social media, newsletters, or your own blog; broad exposure increases chances of backlinks and shares.
Bonus Tips for Infographic Link Building (As part of Link Building Services)
- Focus on evergreen topics. Design infographics around themes that don’t become outdated quickly (e.g., broad industry data, timeless processes, best practices). That way, your infographic remains relevant and continues to earn backlinks over time.
- Combine infographics with guest posting (guestographics). Offer your infographic within a guest article or as part of a content package for other sites. Many websites love ready-made visuals and are more likely to accept content that already includes design.
- Monitor performance & follow u.p Track referral traffic, backlinks earned, and engagement metrics (shares, time on page, bounce rate). Reach out to people who shared or embedded the infographic, thank them, and build relationships. This can open doors for further collaboration or more links.
- Update or refresh infographics occasionally. If the topic involves changing data (e.g, market stats, trends), update the infographic when new data becomes available. This can revive interest and earn fresh backlinks.
- Optimize for accessibility and embedding. Make sure the infographic loads quickly, is mobile‑friendly, and offers embed code so that others can easily add it to their sites.
Conclusion
Think of infographic link building as more than just “another tactic.” It is a strategic asset. With careful planning, the right topic, solid data, attractive design, optimized publishing, and smart outreach, you can create a powerful link‑building engine. Over time, this can deliver strong results.
If you’re offering or buying link-building services, integrating infographic-based campaigns offers a compelling way to stand out. As with anything, success boils down to strategy: valuable data, clear design, smart outreach, and consistent follow‑up.
FAQs
Is Infographic Link Building Difficult?
Not really. If you have access to good data and use intuitive design tools, creating an infographic is manageable. The real challenge is choosing the right topic, ensuring high-quality design, and running a smart outreach strategy.
Can You Put Links in Infographics?
Yes. But the most important part is providing a proper embed code or link on the page where the infographic is hosted. Your infographic can include a logo or URL, but the backlink counts when it comes from the page embedding it.
How Do You Create an Infographic Link Building Campaign?
Start by defining clear goals and your audience. Then:
- Gather credible data.
- Design a compelling infographic.
- Optimize it for SEO.
- Publish it on your website.
- Promote it through outreach, guest posts, directories, and social media shares.